• Home
  • About
    • About PBD
    • What Are Geospatial Technologies?
    • Matteo Luccio’s Bio
    • Conferences
    • Our Name
  • Topics
    • 3D imaging
    • Aerial photography
    • Bathymetry
    • Building Information Modeling (BIM)
    • CAD
    • Energy
    • Cadaster
    • Environment
    • Geodesy
    • GIS
    • LiDAR
    • Mapping
    • Navigation
    • Open source software
    • Other
    • Photogrammetry
    • Precision agriculture
    • Radar
    • Remote sensing
    • Satellite imaging
    • Satellite navigation
    • Seismology
    • Sensors
    • Surveying
    • UAS
    • Tracking
  • Magazines
    • Apogeo Spatial
    • ArcNews
    • ArcWatch
    • CE News
    • Earth Imaging Journal
    • GEOInformatics
    • GeoWorld
    • GIM International
    • Heights
    • Informed Infrastruct.
    • Imaging Notes
    • Point of Beginning
    • Prof. Surveyor Mag.
    • Sensors & Systems
    • Septentrio Insights
    • The American Surveyor
    • xyHt
  • Formats
    • Feature articles
    • Short articles
    • Interviews
    • News items
    • Other
  • All
  • Clients
  • Tips
    • Gripes
    • Tips
  • Contact Us
 

Mapping the Damage from Superstorm Sandy

Posted by: Matteo    Tags:      Posted date:  July 22, 2013  |  No comment


When it hit the United States as a post-tropical cyclone, Sandy had a diameter of 1,100 miles and had been the largest Atlantic hurricane on record. It affected 24 states, including the entire Eastern Seaboard from Florida to Maine, causing particularly severe damage in New Jersey and New York. It clobbered the boarded-up big cities of the Northeast Corridor—including Washington, Baltimore, Philadelphia, New York, and Boston—with stinging rain and gusts more than 85 miles per hour. Storm surges, made worse by the full moon, caused high tides to rise about 20% higher than normal.

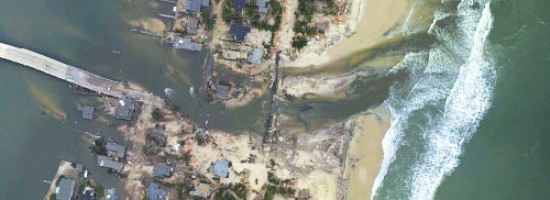
In the wake of the devastation wreaked by Sandy, dozens of federal, state, and local agencies, as well as many private companies, contributed to the response.  Among others, the National Geodetic Survey (NGS) took aerial imagery of the damage, ImageCat helped to analyze the data, Pictometry took oblique imagery, Woolpert flew lidar, and Esri helped FEMA set up a geoportal.

Read more…


Want to say something?


  Cancel Reply


+ 3 = six

« Measuring Distant Winds: Remote Sensing for Siting Wind Turbines
Applying Spatial and Temporal Intelligence to Marine Spatial Planning »


Copyright (c) 2012 by Pale Blue Dot, LLC / For information write to matteo@palebluedotllc.com