Using CartoDB: From creating a map in eight minutes to creating market predictions
Among the many mapping programs available, CartoDB stands out for its ease of use and sophistication. It allows users to import and display datasets in 12 different formats, including Esri shapefiles, Google Earth’s format, Excel spreadsheets, and Open Street Map dumps. Beginners can then style their maps using user-friendly wizards, while advanced users can do so using the CartoCSS syntax language. Beginners can also use drop-down menus to perform such operations as merging datasets and adding layers, while advanced users can write SQL queries.
A data library gives all users access to 160 free, public domain datasets. A free subscription allows for four layers, unlimited views, and unlimited datasets up to a total 250MB of vector data; paid subscriptions offer more layers and storage, as well as private maps. All users have access to the software’s documentation, two-dozen tutorials, and more than a dozen case studies and can get answers to technical questions through a large community of open-source developers. Paid users also have access to technical support directly from CartoDB.
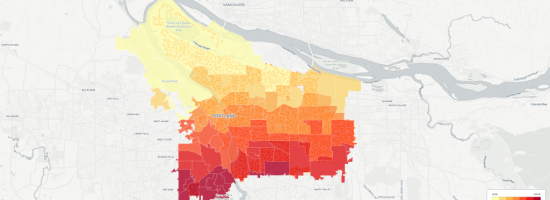
I generated this choropleth map, showing the distribution of about 160,000 street trees in Portland, Oregon’s 95 neighborhoods, in just eight minutes and three steps. (Of course, that was after I had already researched where to find the data I needed, set up a CartoDB account, and spent a few hours learning how to use it.)
Here are my three steps.